A positive user experience is important to success of any service. For calling with Microsoft Teams, the quality of the calls is the perfect metric to measure this success. But there is a significant difference between actual call quality and the perception of poor quality. The use of Microsoft Teams’ Call Quality Dashboard (CQD) and Call Analytics can help bridge the gap between reality and perception.
Call Analytics gives you the ability to investigate a specific call where your user might have had a poor experience. Find out more about Call Analytics here.
In CQD however, you can analyse call quality trends in your organisation. This is good for providing IT leaders with statistics and numbers around the averages across the organisation. More information about CQD can be found here.
With the use of Power BI, you can dig deeper into the data from CQD, as well as get a better understand of the experience across your estate. Microsoft’s Product Engineering team have created some amazing templates to get you started.
Installing the CQD Power BI Report
Pre-requisites
- Report reader role (at a minimum) – More information about access to CQD is available here.
- Power BI Pro licence.
- Power BI Desktop application
Installation
1. Download the QER Power BI templates from here. (v4.4 released 26/07/2021)
2. Once downloaded, extract the contents of the zip folder.
3. Read the QER Release notes, for all the latest updates.
4. Install the Microsoft Call Quality PBI Connector.
- Check to see if your computer already has a [Documents]\Power BI Desktop\Custom Connectors folder. If not, create this folder now.
- Download or use the supplied connector file (*.pqx file) and place it in the Custom Connectors directory created in Step 1.
- Launch Power BI Desktop.
- Select File > Options and settings > Options > Security
- Under Data Extensions, select (Not Recommended) Allow any extension to load without validation or warning.
- Select OK, and then restart Power BI Desktop.

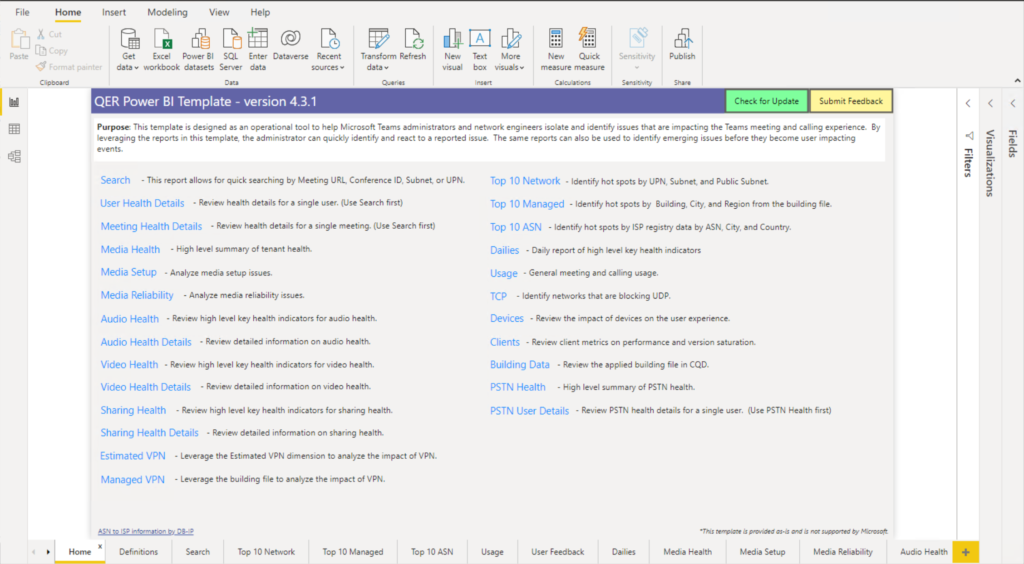
5. Open the QER vx.x.pbit file in Power BI Desktop.
Power BI can be slow to load for the first time, patience is key
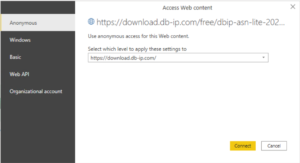
6. Click “Connect” to allow access to the ASN data.
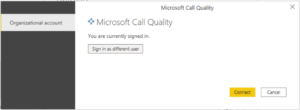
7. Click “Sign in” to connect to CQD data.
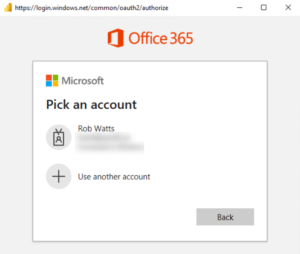
9. Click “Connect”.
Publishing the CQD report to Power BI online
By Publishing this to Power BI online, you can make the report available to others in a Workspace, you’ll also be able to view the data online without the need to use the Power BI Desktop application
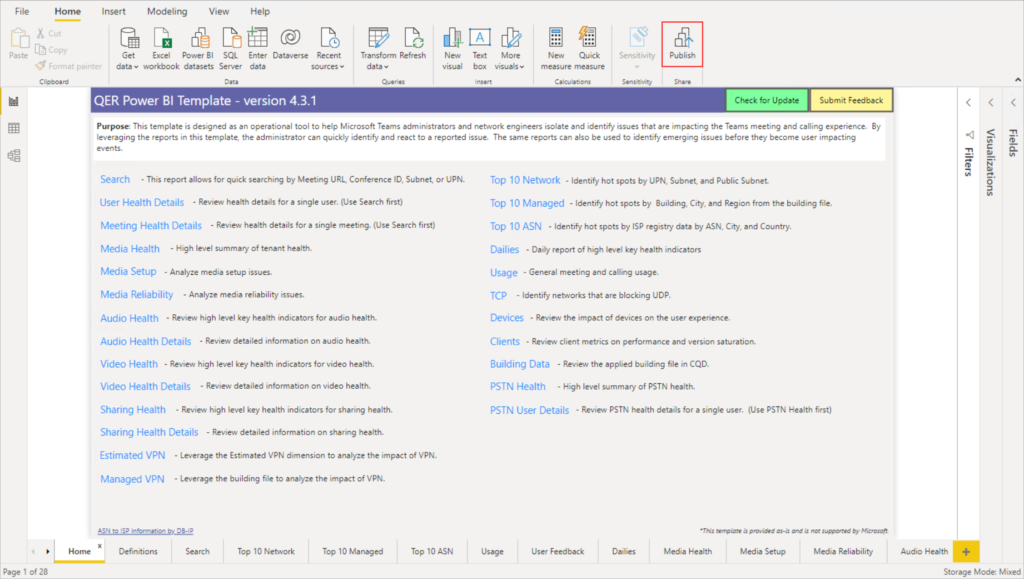
11. Click “Publish” on the ribbon.
12. You’ll be prompted to save changes.
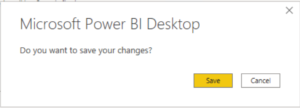
13. When you save the .pbix files, be sure to a friendly name, as this is will be the name of the report in Power BI Online.
14. Now the report has been published to Power BI online, we can refresh the data.

I’d recommend creating a scheduled refresh, this will keep the data up to date.
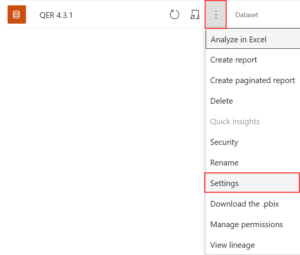
15. Navigate to the Dataset Settings
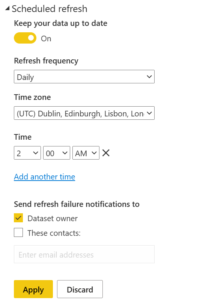
16. Turn on “Keep your data up to date”
17. Select your Request frequency and times.
18. Click “Apply”
You’ve just installed and published the Microsoft Teams CQD QER templates. Take some time to explore the pages in the report!
I’ll be back with another article all about the pages and what to look out for.
Watch this space!


